By Jessica Dobrinsky Clear Lines · updated November 2026Every number sourced
West Virginia Hospital Accountability Dashboard
Who owns West Virginia’s hospitals, what they charge, what they give back and where the public money goes, drawn from cost reports, IRS filings, state records and published research. Hospitals now owned by WVU Medicine and Vandalia Health took in
—
of the net patient revenue at West Virginia’s hospitals in fiscal 2024. Hospitals that are independent today took in
—.
Who owns West Virginia’s hospitals, what they charge and what they give back, in a few numbers. The site is not exhaustive. Filings for some hospitals and years have not been located, gaps are marked rather than estimated, and records are added as they are found.
Every West Virginia hospital in the cost report data for fiscal 2024, placed by ZIP code. Size shows net patient revenue. Select one to open it in the hospital explorer.
Reading the map
One dot is one Medicare provider number. Some systems bill several campuses under one number, so CAMC’s dot in Charleston also stands for its Memorial, Women and Children’s and Teays Valley campuses. Locations are ZIP code centers.
Source:NASHP Hospital Cost Tool, fiscal 2024 Medicare cost reports, 46 hospitals (revenue, charity care, RAND prices); Yale Health Care Affordability Lab, supplemental hospital HHI table, 2007 to 2014 (market concentration). Hospital locations are ZIP code centers.
Find the closest hospitals for the care you need. Every non-profit hospital must also offer financial assistance; check whether you might qualify at the hospital that billed you, and find the application.
Every non-profit hospital must have a written financial assistance policy and must tell patients how to apply. You can apply after you get a bill. Under federal rules for non-profit hospitals (26 C.F.R. § 1.501(r)-6), the hospital must wait at least 120 days after the first bill sent after your care before reporting you to a credit bureau, suing or taking other extraordinary collection actions, and it must pause those actions if you apply within 240 days of that bill.
Hospitals are the most common creditor
In December 2025, 26.6% of U.S. adults said they or a family member owed medical or dental bills they could not pay in full. Among adults with that debt, 52.1% owed a hospital, more than owed any other kind of provider. In the past year, 35.2% of them were contacted by a collection agency, 21.7% said the bills lowered their credit score and 4.7% were sued.
52.1%
of adults with medical debt owed a hospital
37.8%
of adults between 100% and 199% of the poverty line had medical debt, the highest of any income group
25.7%
of insured adults had medical debt, compared with 35.2% of uninsured adults
29 of the 46 hospitals in the table below offer free care to households at or below 200% of the poverty line, and 33 say insured patients with a balance can apply. West Virginia is not among the 14 states the Urban Institute lists as having laws that remove or restrict medical debt from credit reports. If you owe a hospital, check whether you qualify below. You can apply after you get a bill.
Source: Michael Karpman, More than One-Quarter of US Adults Had Medical Debt in 2025, Urban Institute, October 2026, figures 2, 3 and 5, from the Well-Being and Basic Needs Survey, December 2025, more than 10,000 adults. National estimates; the report gives no state figures. Hospital policy count from the financial assistance table on this page.
Interactive tool
Check whether you might qualify
Pick the hospital that billed you, then enter your household size and yearly income. The answer uses that hospital’s own posted policy.
This is an estimate, not a decision, and it is not legal or financial advice. Only the hospital can approve financial assistance. Policies also weigh things this tool does not ask about, such as assets, insurance, residency and the size of the bill. If you are close to a limit, or above it with a large bill, apply anyway. Nothing you type here is saved or sent anywhere.
Want help applying?
Dollar For is a national non-profit that helps patients with hospital bills for free. Its quick check shows whether you are likely to qualify for help at your hospital. You can then apply yourself using its tips, or have Dollar For prepare and submit the application for you. If you already paid toward a bill you qualified to have forgiven, it can help you seek a refund.
It helps only with hospital bills, not bills from doctors or other providers. It does not pay bills, the hospital makes the final decision, and Dollar For says it cannot guarantee a bill will be eliminated.
Source: Each hospital’s posted financial assistance policy, read Oct. 14, 2026. Income limits use the 2026 HHS poverty guidelines.
Income limits are stated as a percent of the federal poverty guideline (HHS, Jan. 15, 2026: $15,960 for one person, plus $5,680 for each added person). Policies change. If a link fails, call the hospital’s billing office and ask for the financial assistance application by name. Each hospital’s own current policy controls; see terms of use.
How a few systems came to own most of the market, how much they hold in reserves and debt, what they tell their lenders, and how much public money flows to them. Coverage is not yet complete; filings are added as they are located.
Share of hospital net patient revenue, fiscal 2024
Grouped by who owns each hospital today. Weirton joined WVU Medicine in January 2025.
Source:NASHP Hospital Cost Tool, fiscal 2024 Medicare cost reports, 46 hospitals. Owner groups as of October 2026, from system announcements and Health Care Authority filings.
Days of cash on hand, selected hospitals and systems
A selection of fourteen organizations, not every hospital in the state, each at the latest year on file, so the years differ (shown after each name). Two are whole systems; the rest are single hospitals. How long each could pay its bills from cash and reserves with no new money. WVU, Vandalia, Boone and Wheeling report their own counts. Minnie Hamilton is calculated from audited statements; Cabell Huntington, St. Mary’s, United Hospital Center, Camden-Clark, Thomas, Mon General, Davis, Sistersville and Montgomery General are calculated from IRS Form 990. Hospitals inside a system often keep cash at the parent, so a low figure for a system hospital is not a sign of distress. See the year-by-year table below.
Source: WVU Health System audited statements, 2025; Vandalia Health audited statements, 2025, Note 6; Boone Memorial Hospital audited statements, FY2025; Wheeling Hospital audited statements, 2024; Minnie Hamilton Health System audited statements, 2024; Cabell Huntington Hospital IRS Form 990, fiscal year ended Sept. 30, 2025, Parts IX and X; Sistersville General Hospital IRS Form 990, fiscal year ended Sept. 30, 2024, Parts IX and X; Montgomery General Hospital IRS Form 990, 2024, Parts IX and X.
Cash cushions, and where the systems put their money
Days of cash on hand measures how long a hospital could keep paying its bills with no new revenue. It leaves out investments a system can sell, so the systems’ investments, debt and net assets are shown beside it. This is a selection, not every West Virginia hospital: the two largest systems, hospitals that later joined them, the Marshall Health Network hospitals and the independent hospitals whose filings were located. Systems and most hospitals are from audited financial statements; the Mon Health, Davis and Marshall hospitals are calculated from IRS Form 990. Fiscal years end on different dates, so a column compares years, not the same day. Each box is one fiscal year; a striped box is a year with no statement on file for this page.
Under 30 days30 to 8990 to 149150 or moreNo statement on fileWVU: part of WVU Health System, no separate statement on file
Swipe the table sideways to see every year.
Source: Audited financial statements of each organization: WVU Health System (2019 to 2025), Vandalia Health and CAMC Health System (2015 to 2025), Wheeling Hospital (2016 to 2024), Princeton Community Hospital (2011 to 2021), Boone Memorial Hospital (FY2015 to FY2017 and FY2021 to FY2025), Minnie Hamilton Health System (2021 to 2024), Grant Memorial Hospital (FY2022 to FY2023).
CAMC Health System’s statements for 2013 to 2017 report board-designated and donor-restricted funds as one figure, so its first measure for those years is an upper bound. Cabell Huntington’s consolidated statements, which include St. Mary’s, carry the Marshall Health Network name from fiscal 2024; they report no short-term investments, so the second measure is cash alone.
Form 990 rows: the first measure counts cash, savings and investment securities (Part X lines 1, 2, 11 and 12); the second counts cash and savings only. Form 990 does not separate board-designated reserves from other investments, so the first measure can include funds a board cannot freely spend. Daily spending is total functional expenses minus depreciation (Part IX lines 25 and 22). Hospitals inside a system often hold their cash and investments at the parent, so a low hospital figure after joining does not mean the system lacks money. Mon General and Marion filed six-month returns for July to December 2022; the page shows their full fiscal year ending June 30, 2022.
No figures are estimated or filled in. Statements used here come from bondholder disclosures, the Federal Audit Clearinghouse and documents obtained for Clear Lines reporting. A striped year means none was located, not that none exists. † CAMC Health System, Inc. renamed itself Vandalia Health, Inc.; its 2021 statements carry the CAMC name and its 2022 statements the Vandalia name. The orange rule marks 2022, the first year under the new name and the year Mon Health’s hospitals joined. Each system’s total changes as hospitals join, so a jump can reflect new hospitals rather than new money. Cash at the end of 2020 was boosted by Medicare advance payments that had to be repaid: WVU Health System carried a $247.5 million liability for them, and CAMC Health System received $117.1 million that year (WVU 2020 statements, balance sheet and Note 16; CAMC 2021 statements, Note 2).
Loading.
WVU Health System
Total investments, long-term debt and unrestricted net assets, dollars. Audited statements, 2019 to 2025.
InvestmentsLong-term debtUnrestricted net assets
Source: West Virginia University Health System and Controlled Entities, consolidated audited financial statements, 2019 to 2025.
Vandalia Health
Same measures, 2013 to 2025, with no statement on file for some years. Statements carry the CAMC Health System name through 2021.
InvestmentsLong-term debtUnrestricted net assets
Source: CAMC Health System and Vandalia Health, Inc. and Subsidiaries, audited financial statements, 2020 to 2025.
Debt nearly tripledVandalia debt, 2021 to 2024, from $345 million to $971 million. It took on $178 million with Mon Health in 2022 and issued $524 million in bonds in 2023, the year it paid $85.2 million for Greenbrier Valley, $92.1 million for Plateau and $53.0 million for 69.5% of Charleston Surgical.
Vandalia Health audited statements, 2022 to 2024
$4.01 billionWVU Health System’s unrestricted net assets at the end of 2025, up from $2.30 billion in 2021. Affiliations with Wheeling, Uniontown, Barnesville, Garrett, Thomas, Princeton, Grant and Weirton added about $327 million in contributed net assets over the period.
WVU Health System audited statements, 2021 to 2025
138 daysBoone Memorial’s days of cash in fiscal 2025. Its statements that year show no board-designated reserves, so both measures match. In fiscal 2015 to 2017 it held between 80 and 91 days.
Boone Memorial audited statements, FY2015 to FY2017 and FY2025
37 daysWheeling Hospital in 2024 counting board-designated reserves, three years after WVU Health System became its sole member. Its own count was 18 days. It had 200 days in 2016. In 2020, before WVU took over, it agreed to pay $50 million to settle False Claims Act allegations, with no determination of liability (U.S. Attorney, N.D. W. Va., Sept. 9, 2020).
Wheeling Hospital audited statements, 2016 to 2024
What it means. Days of cash alone does not show how much money a hospital has. Boone Memorial and Minnie Hamilton show no board-designated reserves in their recent statements, so their cushion is the cash itself. WVU and Vandalia hold most of theirs as board-designated investments, money their boards control and can redirect. Vandalia’s count fell from 172 days in 2021 to 81 in 2025 while its debt nearly tripled and it bought hospitals; its unrestricted net assets passed $1.2 billion. WVU added hospitals including Wheeling and Uniontown by becoming each one’s sole member rather than buying it, with commitments of $100 million and $50 million in future capital spending, and its unrestricted net assets reached $4.01 billion in 2025 (WVU 2022 statements, pp. 48 and 50).
Two measures are shown. The default adds board-designated reserves, which a board can redirect at will, to cash and short-term investments; the second counts only cash and short-term investments. Daily spending is operating expenses minus depreciation and amortization, divided by 365. Systems report their own counts, which run a few days different from these calculations; hover over a year to see both. Boone Memorial’s own count for fiscal 2023 is 175 days in its 2023 statements and 157 in its 2024 statements; the page uses its own calculation from the balance sheet.
What the systems tell their lenders
When a hospital system borrows by selling bonds, it agrees to keep reporting to bondholders; WVU and Vandalia report every quarter. Credit rating agencies grade how safe the loan is. The reports are public on the MSRB’s EMMA website. Federal securities law prohibits material misstatements in these reports.
Days of cash each system reported to its lenders
Year-end figures from each system’s disclosures to bondholders. WVU’s covenant reports list a 90-day minimum, and Moody’s reports a 45-day days-cash covenant at Vandalia. From 2023, Vandalia figures are for the hospitals that back its bonds. For 2018 to 2022 the line shows the consolidated days of cash stated in CAMC Health System’s and then Vandalia’s audited statements, which the system files with bondholders; CAMC is the same corporation that renamed itself Vandalia in 2022.
WVU Health SystemCAMC Health System, then Vandalia Health
Source: WVU Health System annual continuing disclosures; CAMC Health System audited statements, 2018 to 2020, and Vandalia Health audited statements, 2021 and 2022 (days of cash as stated); Vandalia Health quarterly and annual disclosures to bondholders, obligated group, 2023 to 2025; all filed on the MSRB EMMA system.
$380 millionAdded to WVU hospitals’ revenue by the state’s directed payment program in the first nine months of 2025. After the hospital taxes that fund it, the gain was $267 million.
WVU Health System quarterly report to bondholders, Sept. 30, 2025, p. 6
43.2%WVU’s share of West Virginia’s hospital market in 2024, up from 33.1% in 2021.
WVU Health System annual disclosure to bondholders, FY2025, p. 7
71 daysVandalia’s lowest days of cash, at June 30, 2025, while state directed payments were delayed. Management said it would have been 85.91 days without the delay.
Vandalia Health quarterly report to bondholders, June 30, 2025
What it means. Both systems’ bond disclosures credit the state’s directed payment program, funded by hospital taxes and federal Medicaid match, for much of their recent improvement, and the rating agencies say the same. In the Legislature, the hospital association describes hospitals as financially fragile.
More from the bondholder filings: credit ratings, Vandalia’s rural hospitals, drug costs, building plans and a correction
The grades, in plain terms
Ratings run from AAA, the safest, down through AA, A and BBB. Anything BBB- or higher is called investment grade. Moody’s uses a parallel scale (Aa, A, Baa).
S&P
Moody’s
What it means
WVU Health System
A, stable
A2, stable
Strong. Low risk of missing a payment.
Vandalia Health
BBB+, stable
Baa1, stable
Adequate. BBB+ is the top notch of the BBB category, the lowest investment-grade category.
Source: S&P Global Ratings and Moody’s Investors Service reports on WVU Health System and Vandalia Health, as dated below the table.
Latest reviews: WVU, Moody’s June 24, 2026 (affirmation) and S&P July 10, 2026 (full analysis; last S&P rating action May 27, 2025). Vandalia, S&P Jan. 10, 2025 and Moody’s Feb. 25, 2026.
What the rating agencies said about directed payments
On WVU: the improvement “was primarily driven by a substantial increase of $450 million in Medicaid supplemental funding resulting from enhanced reimbursement under the state’s Directed Payment Program (DPP).” S&P, July 10, 2026, p. 2
On Vandalia: the better outlook “reflects Vandalia Health’s improved cashflow, supported by new directed payment program (DPP) funds.” Moody’s, Feb. 25, 2026, p. 1
On Vandalia, 15 months earlier: “potential challenges in improving liquidity due to ongoing revenue cycle issues and lingering impacts of recently integrated hospitals.” Moody’s, Nov. 18, 2024, p. 1
Vandalia’s rural hospitals, in its bondholder reports
Operating results by hospital, from Vandalia’s reports to bondholders. Reports filed from 2025 on do not break out results by hospital, and from mid-2025 they do not report deliveries.
Hospital
2023
Jan. to Sept. 2024
Greenbrier Valley Medical Center
−$14.9M
−$11.8M
Stonewall Jackson Memorial Hospital
−$3.4M
−$0.7M
Davis Memorial Hospital
joined Dec. 2023
−$11.1M
Source: Vandalia Health quarterly disclosures to bondholders, 2024, filed on the MSRB EMMA system.
What WVU told lenders about drug costs
WVU’s quarterly reports from mid-2025 through mid-2026 tie rising drug spending to 340B, without saying what the program earns.
Drug costs rose 20.7% to $613 million in the first half of 2026, “primarily due to continued utilization of contract pharmacies to maximize the benefit opportunity for patients associated with the 340B program.” WVU Health System quarterly report, June 30, 2026, p. 7
What WVU tells investors it is building
From WVU Health System’s event notices filed with bondholders.
More than $1.2 billion in capital projects over three years, including $350 million approved for 2026 (April 15, 2026 notice).
Five Pennsylvania hospitals joined on Oct. 1, 2026: Butler Memorial, Clarion, Frick, Latrobe and Westmoreland, with 925 beds and nearly 7,000 employees. WVU committed $800 million over five years to them. It now runs 30 hospitals in four states with $10 billion in operating revenue (Oct. 2, 2026 notice).
A new small community hospital in St. Clairsville, Ohio, built by Wheeling Hospital, with inpatient beds and an emergency department. Estimated cost: $56 million (April 15, 2026 notice).
A $135 million patient tower at Camden Clark in Parkersburg, raising beds from 260 to 300, with a proposed labor and delivery floor (April 15, 2026 notice).
For comparison: in West Virginia, Mon Health’s $56 million, 29-bed replacement for Stonewall Jackson Memorial Hospital in Weston spent years in Certificate of Need proceedings. WVU Medicine’s St. Joseph’s Hospital of Buckhannon intervened against it as an affected party and appealed, and in November 2025 the state Supreme Court ruled for St. Joseph’s that the relocation needs a CON (No. 24-347). Ohio does not require a CON for a new hospital.
A correction WVU filed with lenders
Voluntary disclosure, posted Aug. 25, 2025.
WVU restated its debt-coverage ratio for 2023 from 4.05 to 3.38 and for 2024 from 4.85 to 3.72. It said it had found “certain historical inaccuracies,” which “primarily included an inadvertent omission of capitalized rentals.” The restated figures still show WVU earning more than three times its largest annual debt payment. WVU notes this ratio is reported to lenders but is not itself a tested loan covenant.
How the market consolidated, 2011 to 2024
Loading.
Public money
Directed payments run on a provider tax. Hospitals pay a tax that the state returns to them as higher Medicaid payments, and the state bills Washington for the federal match on the higher spending. Paragon Health Institute calls provider taxes “a legalized money laundering tactic” and notes that the schemes “start with providers lobbying for the imposition of a tax on themselves” (Sigaud and Kleinworth, Debunking the Provider Tax Myth, p. 1). The West Virginia Hospital Association has initiated or backed the state’s hospital tax and payment programs in nearly every year on record. Critical access hospitals were not eligible until state fiscal year 2025, and payments follow claim volume, so most of the money goes to the largest systems.
Hospital directed payments authorized, SFY2025
$1.34 billion
up from $344.0 million the year before. CMS-approved preprints
Source: CMS-approved 42 CFR 438.6(c) preprints, SFY2024 and SFY2025, Q4 and Q20b
in directed payments, up from $170.8 million. Audited statements
Source: WVU Health System 2025 audited financial statements, Note 3
Vandalia Health, calendar 2025
$359.3 million
up from $75.9 million. Audited statements
Source: Vandalia Health 2025 audited financial statements, directed payment note
How the program is paid for
Source: CMS-approved directed payment preprint, SFY2025 renewal, Q4 and Q20b. Federal share: $1,086,289,464 of $1,336,557,110.
For scale: in calendar 2025, WVU Health System recorded $773.3 million in directed payments and Vandalia Health $359.3 million (each system’s 2025 audited statements). Calendar years and state fiscal years overlap by six months, so the system totals are not a share of this one program year.
What federal economists found about provider taxes
In 2026, the HHS Office of the Assistant Secretary for Planning and Evaluation (ASPE) published two national studies of provider taxes and directed payments. Neither reports figures for West Virginia.
186%
Average Medicaid payment as a share of Medicare once directed payments are added, 2025, in states that benchmark them to commercial rates. The base rate was 96%.
$43B → $144B
Directed payments to Medicaid managed care plans, 2021 to 2025
80%
Share of provider taxes and donations returned to the same providers through Medicaid payments, a MACPAC estimate ASPE cites
1.5–1.7%
Rise in job-based single-coverage premiums after a state adopted a hospital provider tax
No quality gain. ASPE found “no evidence that the dramatic increase in SDP spending has been associated with any commensurate improvement in quality of care” (Sept. 2026, p. 2).
Who pays the state share. In 2022, $8.4 billion of the $12.3 billion non-federal share of directed payments came from provider taxes or intergovernmental transfers (Sept. 2026, p. 4, citing GAO).
The cost reaches everyone else. The October brief compared 20 states that adopted a hospital provider tax from 2010 to 2019 with states that had not. Single-coverage premiums for job-based insurance rose 1.5% to 1.7% after adoption, which the authors translate into a hospital price increase of about 2.4% (Oct. 2026, pp. 4–7).
Why hospitals back the tax. Hospitals can raise prices for patients outside Medicaid and get the tax back through higher Medicaid payments. The authors write that this “may explain why provider taxes are a rare case where an industry supports taxes being levied on itself” (Oct. 2026, p. 10).
What the 2025 law changes. Directed payments in expansion states are capped at 100% of Medicare (sec. 71116). Provider tax rates are frozen at July 2025 levels, and in expansion states the 6% safe harbor phases down to 3.5% from fiscal 2028 to fiscal 2032 (sec. 71115) (Sept. 2026, p. 8). ASPE estimates the lower threshold could reduce job-based premiums by up to 2.2% to 2.5% by 2032 (Oct. 2026, p. 8).
Limits. The premium study measures private-sector job-based coverage in the states it covers; West Virginia is not among them, and public-sector plans such as PEIA are not measured. The 2032 premium figure and the September report’s savings estimates come from ASPE’s models and their assumptions. ASPE’s page for the September report says the content is under accessibility review.
What it means. The federal government’s own economists describe the arrangement West Virginia’s programs use: a tax the hospital industry supports, returned as higher Medicaid payments, with costs that reach people who never use Medicaid and no measured gain in quality. The 2025 law shrinks the money. How the state divides what remains is still its own decision.
Sources: Mulligan, Volkov, Whitman, Lee, Malani, Knapp and Bai, An Overview of State-Directed Payments and Medicaid Provider Taxes, ASPE Research Report, Sept. 2, 2026, pp. 1, 2, 4, 5 and 8; Volkov, Mulligan and Bai, Financing Medicaid Through Provider Taxes on Hospitals: Spillover Effects on Employment-Based Coverage Premiums, ASPE Issue Brief, Oct. 20, 2026, pp. 1, 4–8 and 10. Both are public domain. The 80% figure is MACPAC’s 2017 estimate, which GAO found appropriate.
Hospital directed payment program, by state fiscal year
Critical access hospitals could not take part until state fiscal year 2025.
Source: CMS-approved 42 CFR 438.6(c) preprints for West Virginia’s hospital directed payment program, SFY2023 to SFY2025, Questions 4 and 20b.
Directed payments received, two largest systems
Calendar years, from each system’s audited statements.
Source: WVU Health System 2025 audited financial statements, Note 3; Vandalia Health 2025 audited financial statements, directed payment program note.
Federal share of the SFY2025 program:
—
Physician directed payments, by state fiscal year
A second program, paid through Medicaid managed care plans to physicians employed by, or billing through, eligible acute care hospitals. For SFY2024 the state set it to lift payment from 45% to 100% of the average commercial rate.
Source: CMS-approved 42 CFR 438.6(c) preprints for West Virginia’s physician directed payment program (OTH1), SFY2023 to SFY2025, Questions 4 and 20b.
When an independent got in
Boone Memorial, an independent critical access hospital in Madison, joined the directed payment program in its first year open to critical access hospitals.
The hospital tax behind directed payments
West Virginia also levies a 2.5% broad-based tax (W. Va. Code § 11-27-9) and a 0.13% practitioner assessment (§ 11-27-39), on top of the 3.37% directed-payment assessment (§ 11-27-38).
When
Rate
Source
Source: Each row lists its source. Rates and statutes: W. Va. Code §§ 11-27-9, 11-27-38 and 11-27-39; WV State Tax Department Administrative Notice 2025-08.
Loading.
What the public money buys
West Virginia draws about $2.88 in federal money for every state Medicaid dollar. The state’s health still ranks near the bottom.
Federal match rate (FMAP)
74.25%
Effective FY2027. Follow the Money, p. 6, citing KFF
Source: KFF, as cited in Follow the Money, p. 6
Medicaid enrollment and cost
504,000
people, about $5.5 billion a year. Follow the Money, pp. 5 to 6
Source: Follow the Money, pp. 5 to 6, and its cited sources
Opioid overdose deaths per 100,000
70.5 vs. 25
West Virginia vs. U.S. Charity Care in WV, p. 4, citing KFF
Source: KFF, as cited in Charity Care in WV, p. 4
Adults with medical debt
13.3% vs. 8.6%
despite a lower uninsured rate, 5.9% vs. 8.0%. Charity Care in WV, p. 4
Source: Charity Care in WV, p. 4, and its cited sources
Nearly 75%Real federal share of Medicaid spending nationally in 2024, up from 60% in 1991, largely through provider tax arrangements and the expansion match.
84%West Virginia’s $401 million directed payment program in GAO’s review was about this share federally funded in practice: $335 million federal, $66 million from non-federal sources.
41.2%Adults with obesity, against 32.8% nationally. 20% have diabetes, against 13%.
Charity Care in WV, p. 4, citing KFF
What it means.Paragon Health Institute‘s research finds that these financing arrangements mostly reward large systems, and that rural hospitals become the political shield for them (Kalisz and Hammond, Rural Hospitals Deserve Better, p. 2). West Virginia’s numbers fit that pattern: the directed payment program nearly quadrupled in one year, and WVU Medicine and Vandalia together reported $1.13 billion in directed payments in calendar 2025, up from $247 million in 2024.
What the 2025 federal budget law (OBBBA) changes for West Virginia, and what Ohio is doing
What OBBBA does to West Virginia
The One Big Beautiful Bill Act, P.L. 119-21.
What the law changes
Freezes provider taxes and lowers the safe harbor in expansion states from 6% to 3.5%, phased in from 2028 to 2032.
Caps new directed payments at Medicare rates in expansion states and phases existing ones down.
From Jan. 1, 2027, able-bodied working-age adults need 80 hours a month of work, training, school or community service; eligibility is rechecked every six months.
Funds a $50 billion Rural Health Transformation Program over five years.
“There are no cuts to Medicaid. OBBB slows spending growth, putting the program on a more sustainable path.” (Paragon, Myth: The OBBB Cuts Medicaid, p. 1)
Paragon expects the provider tax reforms to save more than $200 billion over a decade, and says the 3.5% line is similar to a 2014 Obama administration proposal. (Debunking the Provider Tax Myth, p. 2)
Expansion states are targeted because the 90% match returns nine federal dollars for each state dollar. (Preserve and Improve Medicaid, pp. 7 to 8)
RAND RR-A4098-1-v2, Tables B.1 to B.15. Change in the state Medicaid budget and general fund, millions of dollars, and in enrollment. RAND’s study was funded by Arnold Ventures.
Provision
Medicaid budget
General fund
Enrollment
Source:RAND RR-A4098-1-v2, State-Level Impacts of Key Medicaid Provisions in the One Big Beautiful Bill Act, June 2026, Tables B.1 to B.15.
What it means. The largest hit to the state general fund is the provider tax limit, $1.87 billion cumulative through 2034. That is money West Virginia now raises from hospitals to draw federal match and hand back to them. RAND also projects 102,000 fewer enrollees in 2034, a drop of more than 20%, among the largest percentage declines in the country. WVU Medicine and Vandalia together reported $1.13 billion in directed payments in calendar 2025.
Loading.
Loading.
Loading.
Federal Medicaid DSH payments by hospital, 2019
Federal Medicaid DSH payments by hospital, 2019
What DSH is
Disproportionate share hospital (DSH) payments are supplemental Medicaid payments meant to cover part of what hospitals lose on Medicaid and uninsured patients. Each state gets a fixed federal allotment and puts up its match, often through provider taxes. No hospital may be paid more than its own uncompensated cost for those patients (Third Way, Modernizing the Medicaid DSH Program, p. 4). States must also submit an independent certified DSH audit every year (42 CFR 455.304). West Virginia’s federal allotment rose from $63.6 million in FY2008 to $96.5 million in FY2023, a preliminary figure (KFF State Health Facts, Federal Medicaid DSH Allotments, from Federal Register notices).
Why it matters here
Allotments still reflect each state’s 1992 spending, not current need (Third Way, pp. 2 to 3). Paragon Health Institute says programs meant to support small rural facilities, “such as 340B and disproportionate share hospital programs, were ultimately captured by large, urban hospital systems” (Preserve and Improve Medicaid, pp. 24 to 25). In West Virginia’s 2019 audit, $71.75 million went to 47 hospitals, and two of them, the state’s Mildred Mitchell-Bateman psychiatric hospital and Cabell Huntington, received 47%. Cabell Huntington’s payment was below its own reported Medicaid and uninsured losses, and most of the other recipients were small rural hospitals.
West Virginia’s 2019 Medicaid DSH audit report. Medicaid gap is Medicaid cost minus Medicaid payments, as the audit reports them. Select a column to sort.
Source: West Virginia’s Medicaid disproportionate share hospital audit report for 2019 (42 CFR 455.304).
2019 is the most recent year of hospital-level DSH data CMS has published. Medicaid.gov posts state annual DSH reports through the 2019 state plan rate year; later independent certified audits are available only on request from CMS.
For scale. West Virginia paid $54.2 million in inpatient hospital DSH in SFY2025 and budgeted $61.0 million for SFY2026, plus $18.9 million and $25.1 million for mental health facilities (Bureau for Medical Services, Medicaid Report, August 2025 data, October 2025). The hospital directed payment program authorized for SFY2025 was $1.34 billion, about 25 times the hospital DSH total. DSH is limited to each hospital’s own Medicaid and uninsured losses; directed payments carry no such test.
The independent rural hospitals that remain, how they compare with the hospitals the systems own, how the others joined, and the state rules that treated them differently.
What commercial insurance pays, the payer mix argument, and how much free and discounted care non-profit hospitals report. Coverage is not yet complete; filings are added as they are located.
“Nobody should have to travel far from home to receive medical care.”
Albert L. Wright, Jr., President and CEO, and Nicholas J. Barcellona, Senior Vice President and CFO, West Virginia University Health System, in the letter defending 340B on WVU Medicine’s website. Read the letter (PDF)
The record: WVU Medicine hospitals have used Certificate of Need to oppose care closer to home, including right now.
Charleston · pending now
A WVU hospital is challenging a Ronald McDonald clinic for pregnant women and kids.
Ronald McDonald House Charities is paying to build and run a Care Mobile: a clinic on wheels for pregnant women, new mothers and children.
CAMC provides the doctors. Patients without insurance pay nothing.
On Nov. 6, 2026, WVU’s Thomas Memorial asked to be named an “affected person” and argued the unit needs a full Certificate of Need review.
Thomas lists “OB Services in Rural Areas” among the uses of its own 340B savings.
In 2024, the state let Thomas and WVU Hospitals add a second mobile mammography bus without a new certificate. Thomas says that case differs because WVU already held one for mobile mammography.
89%Five largest systems’ estimated share of West Virginia hospital care, 2023. The three largest held 84%.
Families USA, Table 2
Private health insurance premiums, West Virginia against the U.S., 2011 to 2024
Composite premium across the individual, small group and large group markets, dollars, as published in the repository. Data: Stuart Craig, HI_premium_growth repository, for “Health Care Spending and Insurance Premiums Among the Privately Insured,” Yale Health Care Affordability Lab. MIT License, Copyright (c) 2026 Stuart Craig.
West VirginiaUnited States
Source: Stuart Craig, HI_premium_growth repository, Yale Health Care Affordability Lab. MIT License, Copyright (c) 2026 Stuart Craig.
+126%Growth in the West Virginia composite premium, 2011 to 2024, from $4,419 to $9,975. The U.S. figure grew 78%. Only Mississippi grew faster among the 50 states and D.C.
Data: Stuart Craig, HI_premium_growth repository, for “Health Care Spending and Insurance Premiums Among the Privately Insured,” Yale Health Care Affordability Lab. MIT License, Copyright (c) 2026 Stuart Craig.
$9,975West Virginia’s 2024 composite premium, second highest after Alaska. The U.S. figure was $7,151.
Data: Stuart Craig, HI_premium_growth repository, for “Health Care Spending and Insurance Premiums Among the Privately Insured,” Yale Health Care Affordability Lab. MIT License, Copyright (c) 2026 Stuart Craig.
The payer mix claim, and who it speaks for
The West Virginia Hospital Association says about 75% of hospital payments are set by government below cost, and uses that figure to defend Certificate of Need and to ask for more from PEIA. The figure counts PEIA as government, though state law requires PEIA to pay at least 110% of Medicare. It also averages over a market where two systems hold four of every five patient revenue dollars.
WVHA’s claim
75%
of payments “set by government,” counting PEIA. WVHA, Myth vs. Fact, Jan. 27, 2025
Source: West Virginia Hospital Association, “Myth vs. Fact,” Jan. 27, 2025
Weighted by net patient revenue, fiscal 2024, Medicare cost reports via NASHP. Commercial includes PEIA.
Source:NASHP Hospital Cost Tool, fiscal 2024 Medicare cost reports, 46 hospitals. Weighted by net patient revenue.
Without PEIA, traditional Medicare, Medicare Advantage and Medicaid come to about 64%. WVHA reaches 75% by adding PEIA, which by law pays at least 110% of Medicare. Medicare Advantage plans negotiate their rates.
Fiscal 2024, all 46 West Virginia hospitals in NASHP’s cost report data, grouped by today’s owner. Medicaid share and margin are weighted by each hospital’s net patient revenue.
Share of net patient revenue at all 46 hospitals
Source:NASHP Hospital Cost Tool, fiscal 2024 Medicare cost reports, 46 hospitals. Owner groups as of October 2026, from system announcements and Health Care Authority filings.
Medicaid share of each group’s payer mix
Source:NASHP Hospital Cost Tool, fiscal 2024 Medicare cost reports, 46 hospitals. Owner groups as of October 2026, from system announcements and Health Care Authority filings.
Net margin of each group
Source:NASHP Hospital Cost Tool, fiscal 2024 Medicare cost reports, 46 hospitals. Owner groups as of October 2026, from system announcements and Health Care Authority filings.
What it means. The hospitals with the heaviest Medicaid load and the thinnest margins are independent hospitals and small systems, which together take in a small share of hospital revenue. WVU Medicine and Vandalia take in four of every five patient revenue dollars. WVU Medicine carries a higher Medicaid share than Vandalia, 18.5% against 15.8%, and still posts the highest margin of any group, 9.6%. The state-owned hospital is left out of the margin chart.
What commercial plans pay, by hospital type, national
Percent of Medicare, 2018 to 2023. Families USA, “Big Systems, Bigger Profits,” May 2026, Table 3, on NASHP data including RAND prices.
Recent West Virginia CON fights from Clear Lines reporting. In each, an established hospital used the process against a rival: an independent, a new entrant or another system.
Logan Regional against Boone Memorial, 2026. Boone, an independent critical access hospital, filed for a $4,978,500 ambulatory care center in Chapmanville. Logan Regional, then owned by ScionHealth and acquired by Lifepoint in June 2026, requested a hearing as an affected party. Boone filed the same request against Lifepoint’s application to acquire Logan Regional (CON-13542). CON File #26-2-13540. Stuck in the Gears
Weirton Medical Center against Soleo, 2026. Soleo filed for a three-room infusion suite in Weirton. A hearing was set; Soleo withdrew on July 6. Another CON Job
St. Joseph’s against Stonewall Jackson, 2021 to 2025. St. Joseph’s, a WVU Medicine critical access hospital about 12 miles away, intervened against a $56 million, 29-bed replacement hospital in Weston planned by Mon Health, now part of Vandalia. The HCA denied it in 2022. When Stonewall Jackson then argued the relocation needed no CON under the new $100 million minimum, the West Virginia Supreme Court ruled in November 2025 that it does (No. 24-347). A Third Obstetrics Closure From Vandalia?
In an Iowa study, opposition from an existing provider was associated with a 32 percentage point drop in the chance of approval (Another CON Job).
Loading.
Charity care over time
Financial assistance at 27 non-profit hospitals
$57.9 million
latest Schedule H, fiscal 2023 or later, at cost
Source: IRS Form 990, Schedule H, Part I, line 7a, latest year filed
As a share of their net patient revenue
0.76%
combined; the middle hospital gave 0.63%
Source: Schedule H line 7a over net patient revenue from the matching Medicare cost report via NASHP
Hospitals below 1%
17 of 27
of net patient revenue in financial assistance
Source: Schedule H line 7a over net patient revenue from the matching Medicare cost report via NASHP
For comparison, hospital directed payments authorized for one year
$1.34 billion
SFY2025 program, all eligible hospitals, CMS-approved preprint
Net charity care cost as a share of net patient revenue
Each group’s hospitals combined, by owner in each year. Medicaid expansion began in 2014. Mon Health and Davis Health are shown as their own systems until they joined Vandalia. The dashed Vandalia segment bridges 2023: NASHP has no fiscal 2023 record for CAMC General. Vandalia’s 2022 low point comes from CAMC General’s fiscal 2022 cost report, which shows $1.4 million in charity care; its 2022 Schedule H reports $12.3 million at cost.
Source:NASHP Hospital Cost Tool, Medicare cost reports, fiscal 2011 to 2024, charity care cost and net patient revenue. Each hospital is assigned to its owner in that year.
What the non-profits report to the IRS
Every non-profit hospital files Schedule H with its Form 990. It reports financial assistance (charity care) at cost and the gap between what Medicaid patients cost and what Medicaid paid, each as the hospital filed it. Tax year 2024 is the most recent Form 990 available for most hospitals, because returns are filed and released months after the year ends.
Financial assistance at cost, latest year filed
Schedule H line 7a at cost, over the hospital’s net patient revenue for the same fiscal year from its cost report. Each hospital’s most recent return in this collection that has a matching cost-report year, fiscal 2023 or later.
Source: Each hospital’s IRS Form 990, Schedule H, Part I, line 7a (financial assistance at cost); net patient revenue from the same fiscal year’s Medicare cost report via NASHP.
One hospital over time
Fiscal year
Total expenses
Financial assistance cost (col. c)
Net of offsetting revenue (col. e)
Net, % of net patient revenue
Medicaid cost
Medicaid revenue
Medicaid shortfall
Return, page
Source: The hospital’s IRS Form 990 filings, Schedule H, Part I, lines 7a and 7b, and Part IX total expenses; net patient revenue from Medicare cost reports via NASHP.
Figures are as filed. Financial assistance is shown two ways, both as filed on Schedule H line 7a: the cost (column c) and the cost net of direct offsetting revenue (column e). Charts, rankings and the floor model use the net, the measure the IRS form totals. Many hospitals report some offsetting revenue. *On 42 returns, mostly from small hospitals, the offsetting revenue equals the cost, so the net column is blank; these are marked “Fully offset” and show 0% net in the latest-year ranking. The filing does not show whether that is a reporting choice, an error or real revenue, so the cost is shown beside it. A few other returns look odd and are left as filed: WVU Hospitals reported the same Medicaid revenue, $190,918,353, in 2023 and 2024, and Wheeling Hospital reported negative Medicaid revenue in 2024. Medicaid revenue on Schedule H may not include directed payments; hospitals differ in how they report them.
Interactive model
Model it: what a charity care floor would require
West Virginia ties no charity care amount to the tax exemption. Move the slider to set one, as a share of net patient revenue, and see how far each non-profit hospital is from it. Uses each hospital’s latest Schedule H, fiscal 2023 or later, against its net patient revenue for the same year from the cost report.
2%
Owner
Year
Source: IRS Form 990, Schedule H, Part I, line 7a, latest year filed (fiscal 2023 or later); net patient revenue from the matching Medicare cost report via NASHP.
How to read it: a floor sets how much free and discounted care a hospital must give. Whether patients see more help also depends on who the policy makes eligible. Counting the Medicaid shortfall is a choice some proposals make; the shortfall here is Schedule H line 7b at cost and may leave out directed payments.
Finding eligible patients before the bill
Most charity care still starts with the patient: find the policy, fill out the form, send pay stubs. Dollar For, a national non-profit that helps patients apply, estimates that only 29% of patients who likely qualify for financial assistance receive it. Federal rules already let a non-profit hospital find a patient eligible without an application, using other information it has, which the rules call presumptive eligibility (26 C.F.R. § 1.501(r)-6(c)(2)). In practice, Dollar For writes, it “is often used as a last resort,” applied after repeated billing fails. Undue Medical Debt, a national non-profit that erases medical debt, found the same pattern for insured patients: screening often happens “once an account is past due and has been flagged as bad debt.”
Screening early does not have to cost much
Start by asking. Oregon now requires hospitals to screen patients who are uninsured, on state medical assistance or expected to owe more than $500 (ORS 442.615(2)). In the Oregon Health Authority’s first review, a hospital with no software tool “reported smooth implementation” of a manual pre-screen. Dollar For’s conclusion: “Hospitals don’t need expensive tools to start screening patients.”
Use what the hospital already knows. Undue lists signals hospitals already hold: Medicaid, SNAP or WIC enrollment, homelessness, an earlier approval, or care at a free clinic or federally qualified health center, which must document patients’ income to set its own sliding fees.
It can save staff time. Undue writes that screening insured patients early “could save time and resources, ultimately freeing staff and vendors to focus on accounts where patients can and will pay.”
Software helps, with limits. Many hospitals already buy screening tools bundled with billing services. Some of those tools also score a patient’s “propensity to pay,” which Dollar For warns can flag a patient who qualifies as collectible. Oregon hospitals reported the tools are accurate about 85% of the time, and more accurate when paired with asking the patient.
What it means. Some of what hospitals record as bad debt belongs in charity care. Maryland’s hospital rate commission found that 60% of bad debt from patients under 200% of the poverty line should have been classified as charity care, as Undue reports. Screening every patient before the first bill is a low-cost way to sort that out, and it puts the work on the hospital, which has the data, instead of on a patient who is sick and may not know help exists.
Source: Dollar For, Implementing Transparent Screening and Strengthening Medical Debt Collection Protections, 2025, citing Goldstein et al., “The Path to Charity Care,” Dollar For, April 2024, and Oregon Health Authority, Hospital Prescreening Implementation Interview Summary, January 2025; Undue Medical Debt, Predictive Analytics in the Age of Un(der)insurance: A Primer, pp. 9, 13 and 15, citing Maryland Health Services Cost Review Commission, February 2021; 26 C.F.R. § 1.501(r)-6(c)(2); ORS 442.615(2).
Coverage rose after West Virginia expanded Medicaid in 2014, and hospital charity care fell. What happened to the savings, what coverage did and did not do for health, and how the expansion match came to finance the state’s hospital payments.
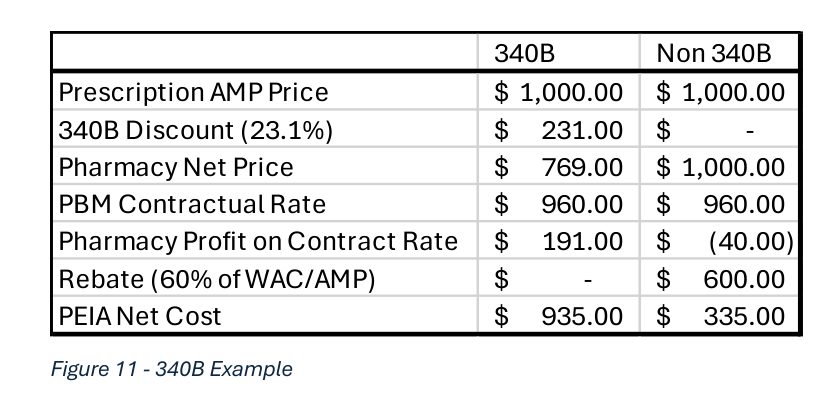
The federal 340B program lets qualifying hospitals buy outpatient drugs at deep discounts while insurers pay their usual rates for those drugs. West Virginia has no reporting law, so almost no hospital says what it earns.
WVU Hospitals 340B savings, 2025
$217.6 million
Morgantown flagship alone, on WVU Medicine’s own 340B page
on a 340B claim vs. the same claim outside 340B, in PEIA’s hypothetical example
Source: PEIA SB 453 report to the Legislature, Dec. 30, 2024, p. 22, Figure 11
West Virginia hospitals in 340B
37
HRSA OPAIS, in the 340B paper, p. 4
Source: HRSA Office of Pharmacy Affairs Information System, as cited in the 340B paper, p. 4
WVU Hospitals: 340B savings against charity care
WVU Medicine is the only West Virginia system that publishes 340B savings. Its page now gives 2025 savings for 19 hospitals and sets them beside a 2024 figure it calls “uncompensated care.” Charity care, the free and discounted care a non-profit hospital gives patients who cannot pay, is a small fraction of either. Boone Memorial reports 340B revenue, a different measure, on its Form 990.
9 statesStates with 340B reporting laws since 2023 include Indiana, Idaho, Ohio, Colorado, Maine, Minnesota, Rhode Island, Vermont and Washington. West Virginia has none.
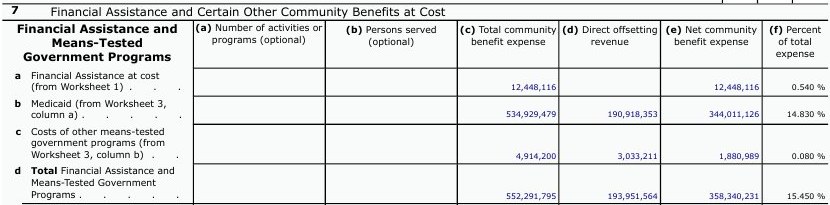
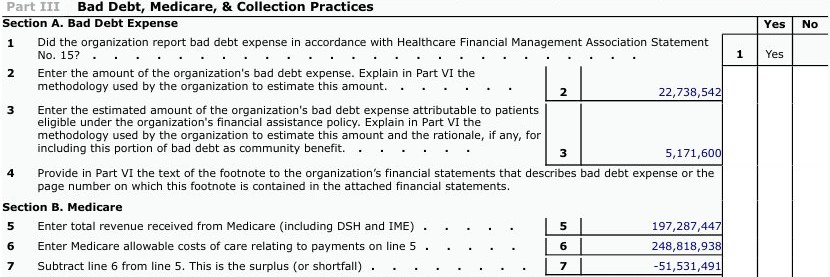
How $12.4 million in charity care becomes $363.5 million in “uncompensated care”
WVU’s 340B page sets its $217.6 million in 340B savings at its Morgantown hospital beside $363.5 million in what it calls “uncompensated care.” Most people hear that and picture free care for patients who can’t pay. That is charity care, and it is the small slice below. The rest is two other things WVU folds in.
What WVU claims
$363.5 million
in “uncompensated care,” WVU Hospitals, 2024
What it actually gave away as charity care
$12.4 million
same hospital, same year, reported to the IRS
Here is what is inside WVU’s number:
The hospital industry’s own trade group doesn’t count it this way. The American Hospital Association defines uncompensated care as charity care plus bad debt, and says it “excludes other unfunded costs of care, such as underpayment from Medicaid and Medicare.” By that definition, WVU Hospitals’ 2024 uncompensated care was at most $35.2 million, even counting every unpaid bill. Charity care alone is 3.4% of the figure WVU publishes.
From the filing: Schedule H, Part I, line 7. Line 7d plus the bad debt below equals WVU’s figure to the dollar.From the filing: Schedule H, Part III. WVU added the $5.2 million on line 3.
Hospital by hospital
At every WVU hospital checked, 340B savings dwarf charity care
For each hospital, three numbers: the 340B savings WVU reports, the “uncompensated care” WVU puts beside them, and the charity care the hospital itself reported to the IRS.
Why 2024 for charity care? Charity care comes from each hospital’s IRS return, and those are filed long after the year ends: WVU Hospitals filed its 2024 return on Nov. 14, 2025. No 2025 return is public yet. WVU’s 340B page gives 2025 savings but no charity care figure for any year, so 2024 is the latest charity care anyone can check.
Show the math: how WVU builds each number from the hospital’s tax filing
Every claim checked equals two lines of the hospital’s IRS Schedule H added together: line 7d, which is charity care plus the Medicaid and other government payment gaps, and bad debt. At WVU Hospitals, WVU added only the bad debt from patients who qualified for financial assistance; at the others, it added all bad debt. At nine of the ten, the unpaid bills counted are larger than the charity care.
Hospital
WVU’s claim
Charity care + Medicaid and other gaps (line 7d)
+ Unpaid bills (bad debt)
Of which charity care (7a)
Left over
Source: Each hospital’s IRS Form 990 for 2024, Schedule H, via ProPublica Nonprofit Explorer; WVU Medicine 340B page. Thomas, St. Joseph’s and Reynolds differ by less than 0.1%, likely a different version of the filing. Berkeley, Jefferson, Uniontown, Garrett, Potomac Valley, Grant, Summersville, Jackson and Harrison not yet checked. Barnesville, in Ohio, matches to the dollar.
In WVU’s own words
WVU says the savings pay for charity care. Its own numbers say otherwise.
Every one of the 19 hospitals with a 340B savings figure on WVU’s page lists “Support for vulnerable population via Charity Care” as a use of the money. At WVU Hospitals, even if every dollar of its 2024 charity care had come out of 340B, 94.3% of its 2025 savings would still have gone to something else.
Most of what else WVU lists is new buildings, equipment and services, such as:
Some of these may be exactly what these communities need. A hospital investing in new services is not the problem; in a competitive market, that is how patients win. The issue is how the money is described. Congress created 340B in 1992 so safety-net providers could “stretch scarce Federal resources as far as possible, reaching more eligible patients and providing more comprehensive services.” The law never defined who those patients are, never required hospitals to report what the savings pay for, and never tied the money to charity care. That gap lets WVU point to charity care while the savings also fund service lines that bill patients and insurers like any other. Reformers, including Paragon Health Institute, have proposed the straightforward fix: report the savings and what they pay for, and let the benefit follow the patient.
WVU Health System’s 2026 letter on its 340B page
“Without it, services could be reduced, and hospitals could be forced to close.”
The year before: WVU Health System’s unrestricted net assets grew from $3.16 billion to $4.01 billion, and it ran a 7.5% operating margin.
Source:WVU Medicine 340B page, “Use of 340B savings” for each hospital, accessed Nov. 16, 2026; WVU Health System letter of support for 340B, 2026, posted on that page; H.R. Rep. No. 102-384, pt. 2, at 12 (1992); Jackson Hammond, “340B 101,” Paragon Health Institute, Sept. 11, 2024, “Solutions”; Anthony M. DiGiorgio, DO, testimony to the House Energy and Commerce Subcommittee on Oversight and Investigations, June 4, 2024; West Virginia University Health System 2025 audited financial statements, consolidated balance sheets and statements of operations; WVU Hospitals IRS Form 990 for 2024, Schedule H, line 7a.
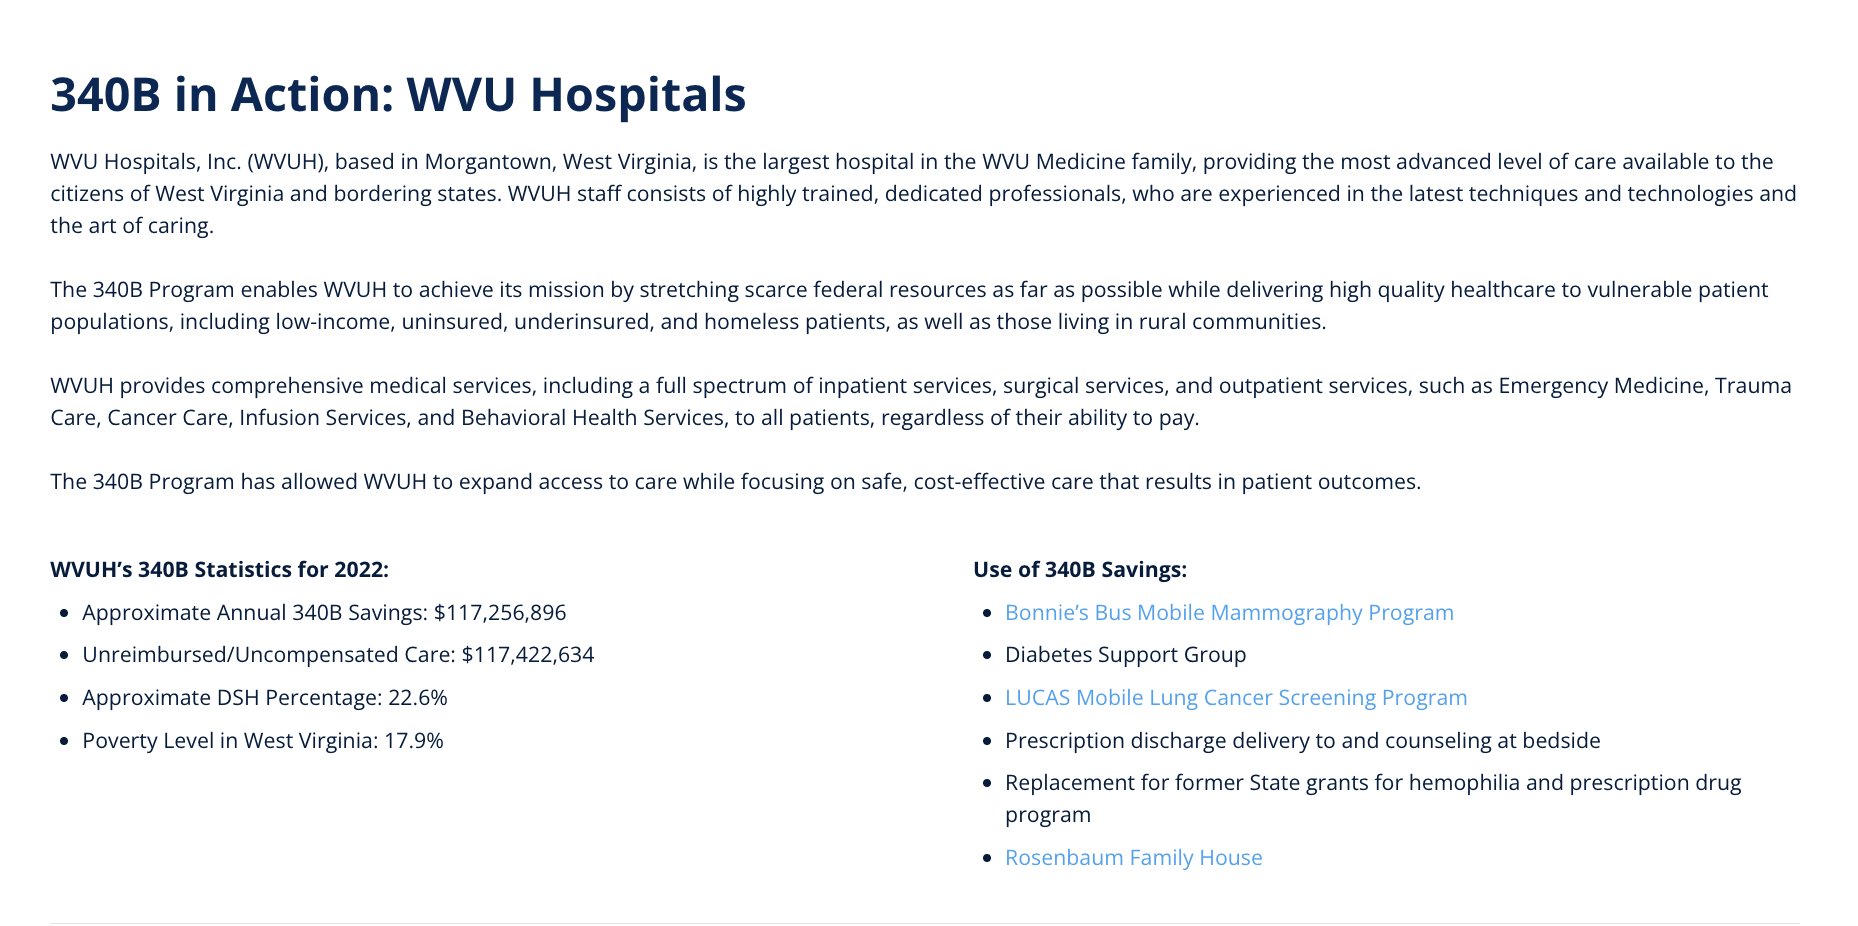
Before the update: one number, two different labels
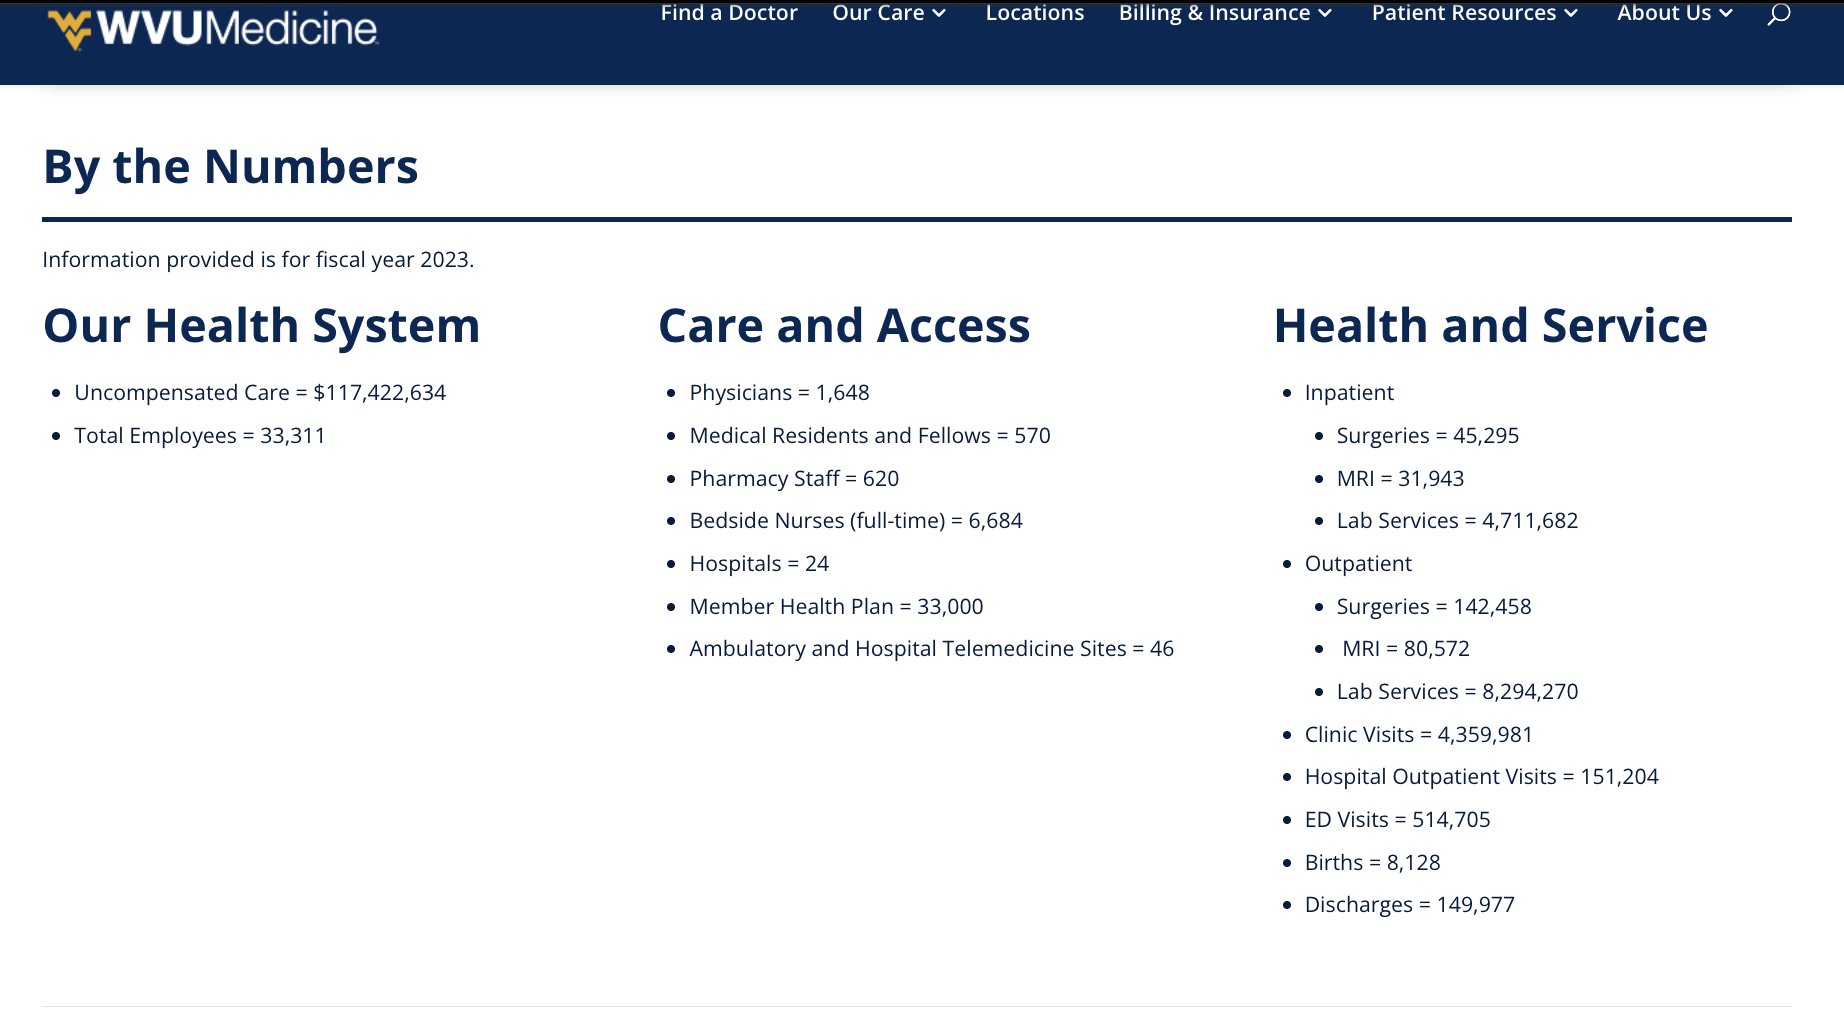
Before the page was updated, WVU published $117,422,634 as WVU Hospitals’ “unreimbursed/uncompensated care” for 2022, on its 340B page, next to 340B savings of $117,256,896. Its “By the Numbers” page listed the identical figure, $117,422,634, as uncompensated care for the whole health system in fiscal 2023. Neither page cited a source, and the number does not match any combination of lines on WVU Hospitals’ Schedule H for any year from 2012 to 2024.
WVU’s earlier 340B page: “WVUH’s 340B Statistics for 2022.”WVU’s earlier “By the Numbers” page: the same figure, now for the health system in fiscal 2023.
The Medicaid payment that didn’t change by a dollar
On WVU Hospitals’ Schedule H, the Medicaid revenue subtracted from Medicaid costs is $190,918,353 for 2023 and $190,918,353 for 2024, identical to the dollar. Medicaid costs rose in between, so the reported Medicaid shortfall rose from $280,800,435 to $344,011,126. The filing does not explain the repeated figure. That shortfall is the largest piece of the “uncompensated care” WVU sets beside its 340B savings.
Source: WVU Hospitals IRS Form 990 for 2023 and for 2024, Schedule H, Part I, line 7b, columns (d) and (e); earlier versions of WVU Medicine’s 340B and “By the Numbers” pages, screenshots.
SB 325: the state law hospitals backed, and where it stands
SB 325 (2024), a West Virginia Hospital Association priority, created W. Va. Code § 60A-8-6a. It bars drug companies from limiting 340B discounts on drugs dispensed through contract pharmacies, and from requiring hospitals to hand over the claims or utilization data that shows how those discounts are used.
Trial court. Drug manufacturers’ trade group PhRMA sued, and a federal district court blocked enforcement.
April 17, 2026. The American Hospital Association, joined by the West Virginia Hospital Association, 340B Health and ASHP, asked the full court to rehear the case.
June 2, 2026. The full Fourth Circuit granted rehearing en banc. The law remains blocked while the full court decides.
What it means. The data SB 325 keeps from drug companies is the same claims data that would show where 340B money goes. West Virginia requires no public 340B reporting of its own.
Labor and delivery closures and service cuts, the hospital association’s claims checked against public records, and its lobbying history. Coverage is not yet complete; filings are added as they are located.
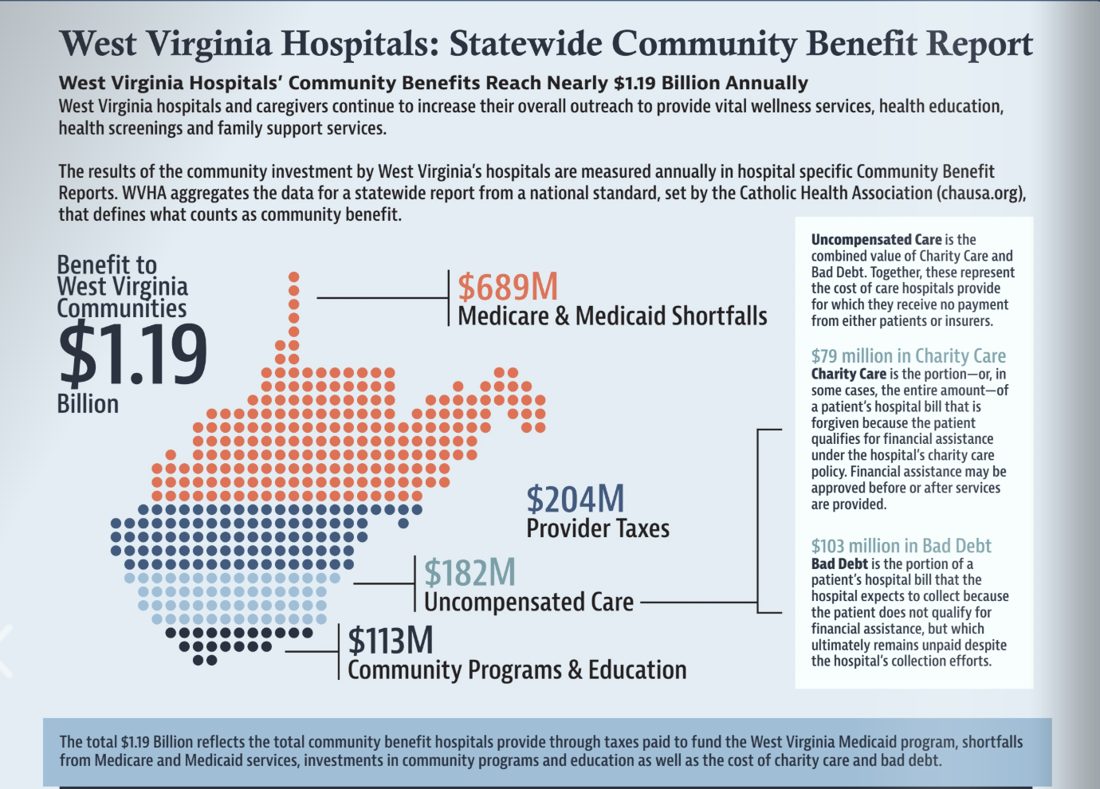
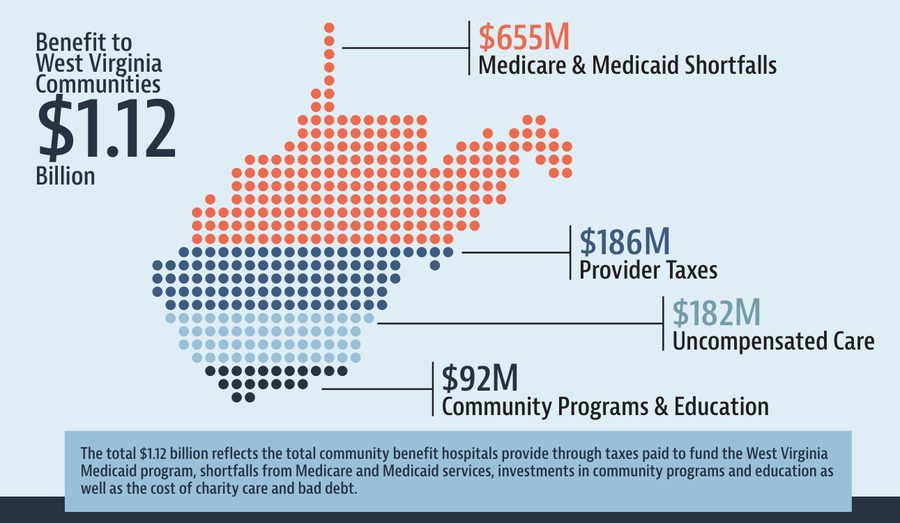
The West Virginia Hospital Association defends Certificate of Need in its Myth vs. Fact sheet, its CON pamphlet, its talking points and its critique of the Mercatus study. Its community benefit reports put hospitals’ annual community benefit at $1.12 billion and, in its 2026 edition, $1.19 billion, and defend the 340B program. Other claims come from its legislative updates and fact sheets. Each claim below is quoted from those documents and checked against cost reports, IRS filings, state records and published research. Where WVHA is right, the verdict says so.
WVHA claims checked
51
from WVHA handouts, reports and talking points
Source: WVHA documents listed with each claim below
False or unsupported
9
4 false, 5 with no support in the sources reviewed
Source: Each verdict lists its sources with the claim
Accurate
6
claims the evidence supports
Source: Each verdict lists its sources with the claim
Revenue at WVU Medicine and Vandalia hospitals
79.8%
of West Virginia hospital net patient revenue, fiscal 2024, by today’s owners. Independent hospitals: 2.0%
Source: NASHP Hospital Cost Tool, fiscal 2024 Medicare cost reports, 46 hospitals. Owner groups as of October 2026, from system announcements and Health Care Authority filings
How to read this section
The claim. Each card quotes a hospital association handout, talking point or report, with the document and page. “See it in WVHA’s document” shows the printed page.
The verdict. Each claim was checked against public records, filings and published research. Use the menus below to show one verdict or one topic.
The evidence. Each point lists its source under it.
Verdicts. False: filings or data show otherwise. Unsupported: no source given or found. Missing context: true as far as it goes, but leaves out facts that change the meaning. Partly true: part holds, part does not. Accurate: the evidence supports it.
Claims the evidence contradicts or does not support
Every claim, by topic and verdict
WVHA’s advocacy record, 2007 to 2026
What the association asked the Legislature for and against, in its year-end legislative summaries, priorities and Certificate of Need materials. Each entry quotes the document.
Loading.
Source: the WVHA Advocacy Record archive of 32 documents, 2007 to 2026. Six entries come from three American Hospital Association documents and are labeled AHA. No 2019 summary is in the archive. Where WVHA listed a bill without stating a stance, the entry says “Reported.”
How WVHA builds its community benefit total
WVHA’s two most recent statewide Community Benefit Reports. Neither gives a data year. Dollars as printed.
What WVHA counts
Sept. 2025 report
2026 report
Medicare and Medicaid shortfalls
$655M
$689M
Provider taxes
$186M
$204M
Uncompensated care
$182M
$182M
of which charity care
not separated
$79M
of which bad debt
not separated
$103M
Community programs and education
$92M
$113M
Total
$1.12B
$1.19B
What it means. Unlike the September 2025 report, the 2026 report separates charity care from bad debt. Charity care, care a patient is told they do not have to pay for, is $79 million, 6.6% of the $1.19 billion total. Bad debt, $103 million, is bills hospitals tried to collect and could not. The largest pieces are Medicare and Medicaid shortfalls measured against hospitals’ own cost accounting and $204 million in provider taxes, which the state uses to draw federal money that returns to hospitals as directed payments.
From the source: WVHA, “West Virginia Hospitals: Statewide Community Benefit Report,” 2026.From the source: WVHA Community Benefit Report, September 2025, p. 2.
Source: WVHA, Community Benefit Report, September 2025, p. 2; WVHA, 2026 Community Benefit Report, “West Virginia Hospitals: Statewide Community Benefit Report.”
Two federal filings, one year, two Medicaid gaps
2019. Schedule H is the hospital’s IRS return; the Medicaid DSH report is the state’s federally required audit of Medicaid and uninsured costs for each hospital. The two use different cost methods, cover different services and may cover different 12-month periods, so their Medicaid gaps differ, sometimes in either direction.
Hospital
Schedule H Medicaid shortfall
DSH audit Medicaid gap
Source: Each hospital’s 2019 IRS Form 990, Schedule H; West Virginia’s 2019 Medicaid DSH audit report (42 CFR 455.304).
Source:NASHP Hospital Cost Tool, Medicare cost reports, fiscal 2011 to 2024. Owner groups as of October 2026, from system announcements and Health Care Authority filings.
Charity care: net charity care cost as a share of net patient revenue. Commercial price: what private insurers pay as a multiple of Medicare (RAND 5.1), where available.
Research, testimony, communications and dashboards like this one, for West Virginia groups and for other states.
Policy solutions that go deeper
I built this dashboard from public records: tax returns, cost reports, court files, state Medicaid filings. I do the same work for other organizations, in West Virginia and in other states.
01
A dashboard like this one
Your state’s hospitals, built from its own filings. Who owns them, what commercial plans pay them, what they report as charity care, how much Medicaid supplemental money they get and what their executives make. A hospital finder and a financial assistance check for patients can come with it.
02
Research and writing
Policy papers and briefs, federal regulatory comments, quick analysis when a bill or rule moves, and one-pagers lawmakers will actually read. I also write and place op-eds.
03
Legislative strategy
Session planning, bill tracking, amendment analysis and member outreach. I draft, prepare and deliver committee testimony. National groups without someone in a state capitol can work through me.
04
Communications and speaking
Messaging, social accounts, paid Meta ads for issue campaigns and content calendars that keep up with a legislative session. I brief legislators and staff, speak on panels and do radio and podcasts.
Testimony
West Virginia Joint Committee on Health
West Virginia House Health Committee
West Virginia Senate Health Committee
Maryland House Health Committee
On air
Sept. 2026 The Tom Roten Show: “What is ‘Certificate of Need’ & Should It Be Repealed?”
July 2026 WRNR Eastern Panhandle Talk: “Certificate of Need and Charity Care in West Virginia”
July 2026 MetroNews Talkline: “Certificate of Need and Post-Acute Care in West Virginia”
May 2026 WRNR Eastern Panhandle Talk: “Labor and Delivery Closures in West Virginia”
Sept. 2025 MetroNews Talkline: “PEIA Solutions for West Virginia”
Feb. 2025 West Virginia Public Broadcasting, The Legislature Today: “Certificate of Need Laws”
In print
Washington Examiner, health policy column, 2021 to 2023
Charleston Gazette-Mail
The Spectator
RealClearPolicy and RealClearMarkets
Washington Times
Forbes
Principles come with proof.
Tell me what you’re working on. I take on projects, fellowships and ongoing support for organizations. I don’t do campaign work.